Connecting · 2 of 8
Monitoring a machine
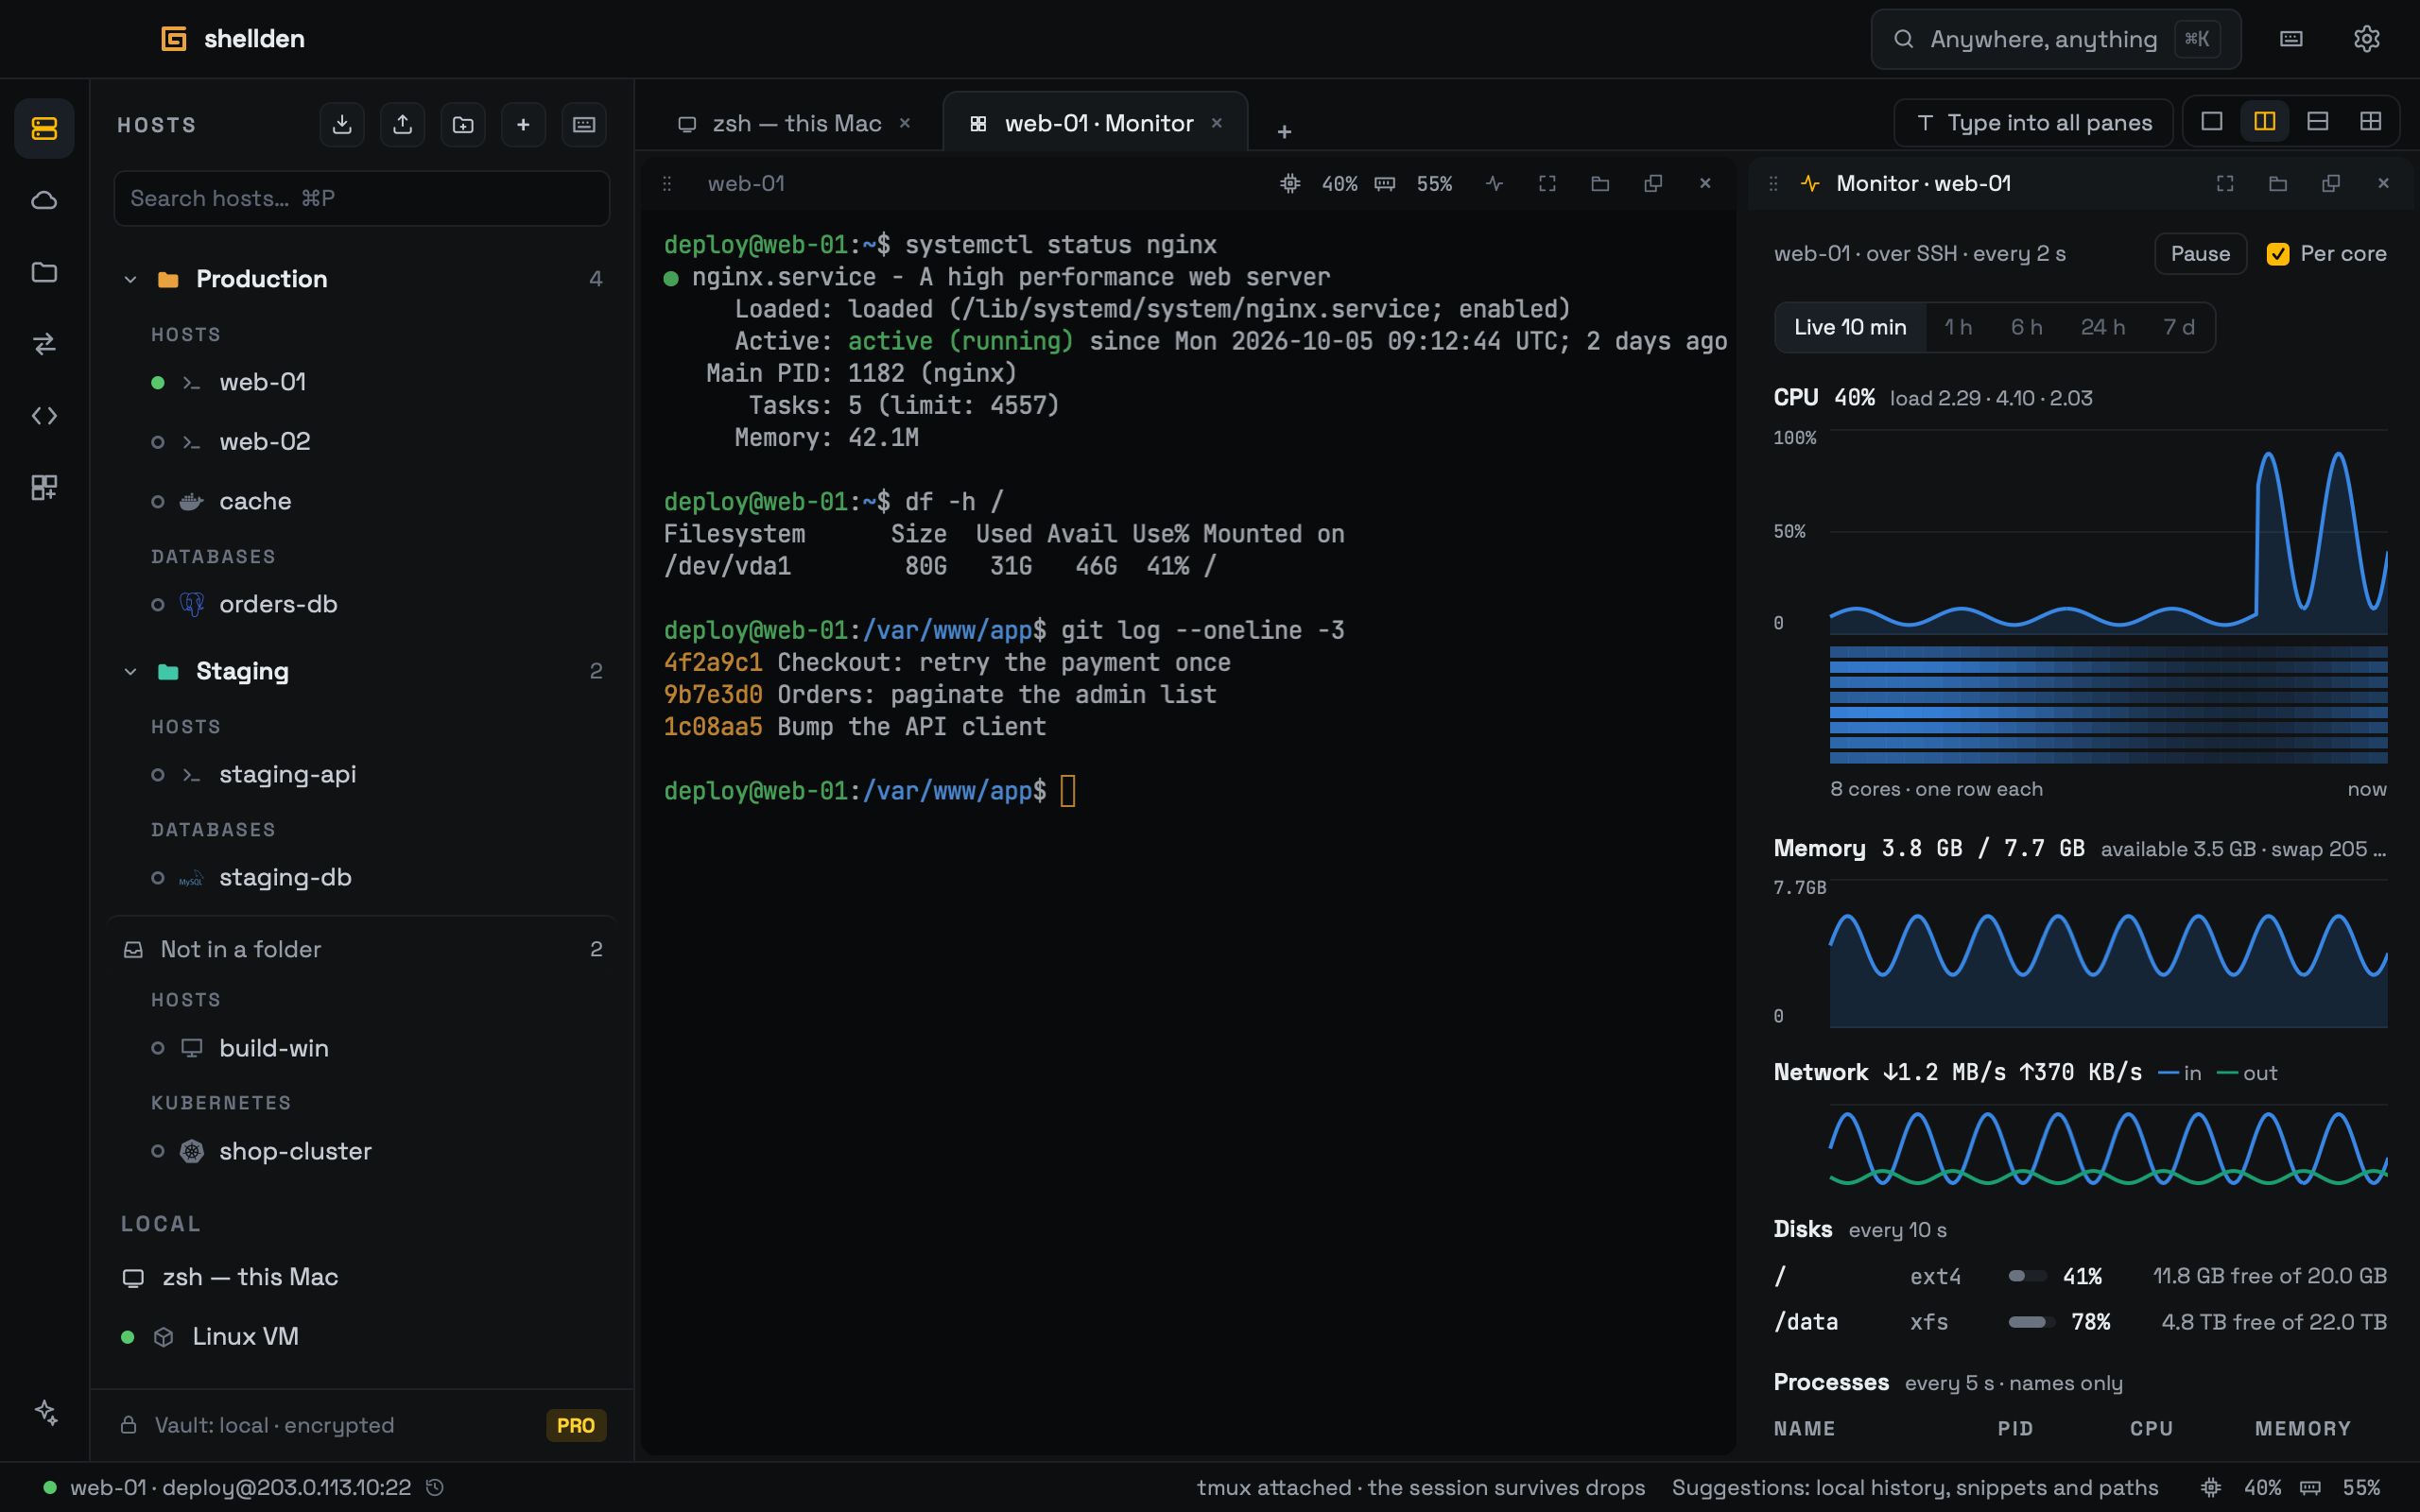
How busy a server is while working on it: its CPU and memory in the status bar, and the Monitor view with charts, partitions, processes and, for a cloud VM, the cloud's own history. Nothing is installed on the server and nothing is kept: the last minutes live in memory only.
Usage in the status bar
An SSH tab, a cloud VM over SSH and a local terminal show the machine's CPU and memory at the right of the status bar, each after its icon (a chip, a memory module). A partition shows only when it is in trouble: 90 % full with under 20 GB free (amber), or 95 % full or under 1 GB free (red).
Colour means "worth a look", never "busy". Memory turns amber when under 10 % is available for two reads, red under 5 %, and clears over 15 %. CPU turns amber only at 95 % or more with the load above 1.5 × the cores for a minute, and never red: a build at 100 % stays plain.
The first read shows — for CPU (it is the difference of two reads). After three failed reads the figures disappear.
Hovering shows the whole line: CPU, memory used of total, each partition, the load and when it was read.
In a narrow window the partition and the network go first, then the numbers. The icons stay.
In a split tab, each pane's bar shows its own machine's CPU and memory. The status bar shows the focused pane's.
The figures are read every 3 s for the tab on screen only. A minimized window reads nothing.
Right-click: Open Monitor, Open Monitor as a tab, Show in the bar ▸ (CPU, Memory, Disks, Network) and, on a saved host, Server usage ▸ (As in Settings, On for this host, Off for this host).
Session Manager, ECS Exec, Mosh, serial, Telnet and servers that allow no commands (ForceCommand, a restricted shell) show no figures. An EC2 tab over Session Manager has a Monitor link that opens the cloud's data instead.
The Monitor view
It opens from a click on the status bar's figures (another click closes it), the figures or the pulse icon on a pane's bar, Monitor in a tab's right-click, Monitor in a host's right-click (opening its terminal first when none is open), Monitor in a Cloud dock VM's right-click, the palette (Monitor this computer, Monitor plus the focused host) and ⇧⌘U.
One per machine: opening it again goes to the one already open. It opens as a pane to the right of the terminal. With four panes in the tab, or too little room, it opens as a tab. The pane bar makes it a tab or moves it to a window. Made a tab once, it opens as a tab from then on.
Live 10 min: CPU with the load and Per core (one row per core), memory used of total with what is available and the swap, network in and out, partitions every 10 s (local filesystems only: network mounts are never read) and, while the table is on screen, processes every 5 s. Processes show their name only, never their command line, and none can be stopped from here.
A command typed in a terminal of the same machine marks the CPU chart with a line and its text, so a spike lines up with what caused it. Marks live in memory only. They need suggestions on for that host (see Suggestions while typing), and a line typed with a leading space is never marked.
Pause holds the charts still to read them. Reading goes on.
It is read every 2 s while on screen and every 10 s while hidden (without partitions or processes). A background tab reads nothing. Each read costs the server about a millisecond: one small script per connection, started once, answers only when asked. It installs and writes nothing and never uses sudo. Its start shows in
ps and in audit logs.With nothing live, one line says why: Reading…, Usage is not available for this host, Stopped responding with Retry, Session closed with Connect, Usage is off for this host with Turn on for this host, or No live usage over Session Manager · cloud data only.
Cloud history
For a VM of AWS, Azure or Google Cloud, 1 h, 6 h, 24 h and 7 d show the cloud's own metrics, and Live 10 min shows its last hour under the live charts. Without a cloud account those ranges stay greyed.
The section always names its source, point size and age, as in "From AWS · CloudWatch · 5-min points · updated 4 min ago". It never says live.
CPU, network and disk reads and writes come from every cloud. Memory: Azure always, Google on the e2 family, AWS with the CloudWatch agent. Disk use per partition needs each cloud's agent. Google's Ops Agent reports it by device, not mount point. When an agent's data arrives its name shows. Otherwise each missing metric says what it needs.
AWS shows its status checks and Azure the VM's availability. Google publishes no health check for VMs, so its line reads VM state only.
A Droplet shows DigitalOcean Monitoring's CPU and public network. Memory and disk use need DigitalOcean's do-agent in the Droplet. Until its data arrives the section says so. A Vultr instance shows its network per day only: Vultr publishes no CPU, memory or disk figures for instances.
The cloud is read every minute, or at the chart's own pace, only while the Monitor is on screen, with the account already signed in: no new permission. A missing role is named. Offline, the last points stay with their age.
Settings
Settings → Terminal → Server usage has Show server usage in the status bar (off stops every read of a server), Usage of this computer, Cloud metrics and Process list. A saved host has its own switch in its right-click and in Edit host → Advanced → Session. All of it is in the Free plan.